Seismic Refraction Introduction.
Classical Seismic Refraction
Reading Resources
CH 6 Seismic Refraction from LITE.
CH 2 Seismic Exploration - Fundamental Considerations from I2AG.
Image files: JPGs in a ZIP file
CH 3 Seismic Exploration - The Refraction Method from I2AG
Image files: JPGs in a ZIP file
The Seismic Sprint
Important
This animated video is the basis of the seismic refraction method.
Note that what is shown in the animation relies on:
The seismic velocity of the lower layer is larger than the upper layer, i.e.
There is a critical angle of incidence,
Tip
The evidence in the video that your waves (P-waves in our case) interacted with a layer is the change in slope of the first "breaks" or "arrivals".
In the video, the data is plotted as distance vs. time, so the slopes are already in units of
However, almost always you will see this type of data plotted as time vs. distance, so that the slopes are in units of
However you plot the data, such a plot is referred to in various ways:
first-break plot
first-arrival plot
travel-time curve of the first arrivals/breaks.
Confusing, eh?
Caution
We will see that it is possible that interaction with a layer boundary does not generate a change in slope. In other words, we can be tricked into thinking the subsurface is something that it isn't 😕. See the section on non-ideal subsrfaces.
Wave names
Note that the video shows many distinct names of the waves along the raypaths:
Direct wave
Critically refracted wave
Head waves
When we were at Brizziolari Creek I didn't use the term head wave and just referred to that as part of the critically refracted wave (to reduce terminology at the moment).
General Behavior of a wave (or raypath) at a boundary
In the above video we only saw the refracted wave that is the critically refracted wave. But the wave has a wavefront, meaning that wave energy reaches the boundary at all angles - not just the critical angle. So what happens in the general case where the angle of incidence on the boundary,
This is encapsulated in Snell's Law:
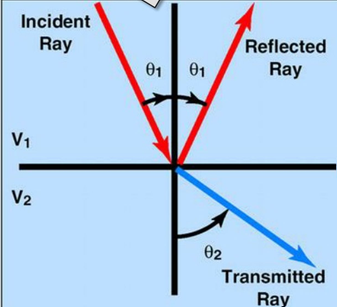
Figure 1. Illustration of the typical case for reflected and transmitted (or, refracted) waves as a boundary.
Question: In Figure 1 just above, it is implied that
Note
The formula for Snell's Law and Figure 1 above (assume
Please watch the linked to animated video. It shows the idea of a wavefront, rather than just single raypaths, as well as all the cases of incidence angle at a boundary.
Important
All the wave arrivals following the first-arrivals we are interested in make the recordings of the waves at each geophone ("seismograms") very complex - a lots of wave types arrive, as seen in the video. This is illustrated with real data in the figure below:
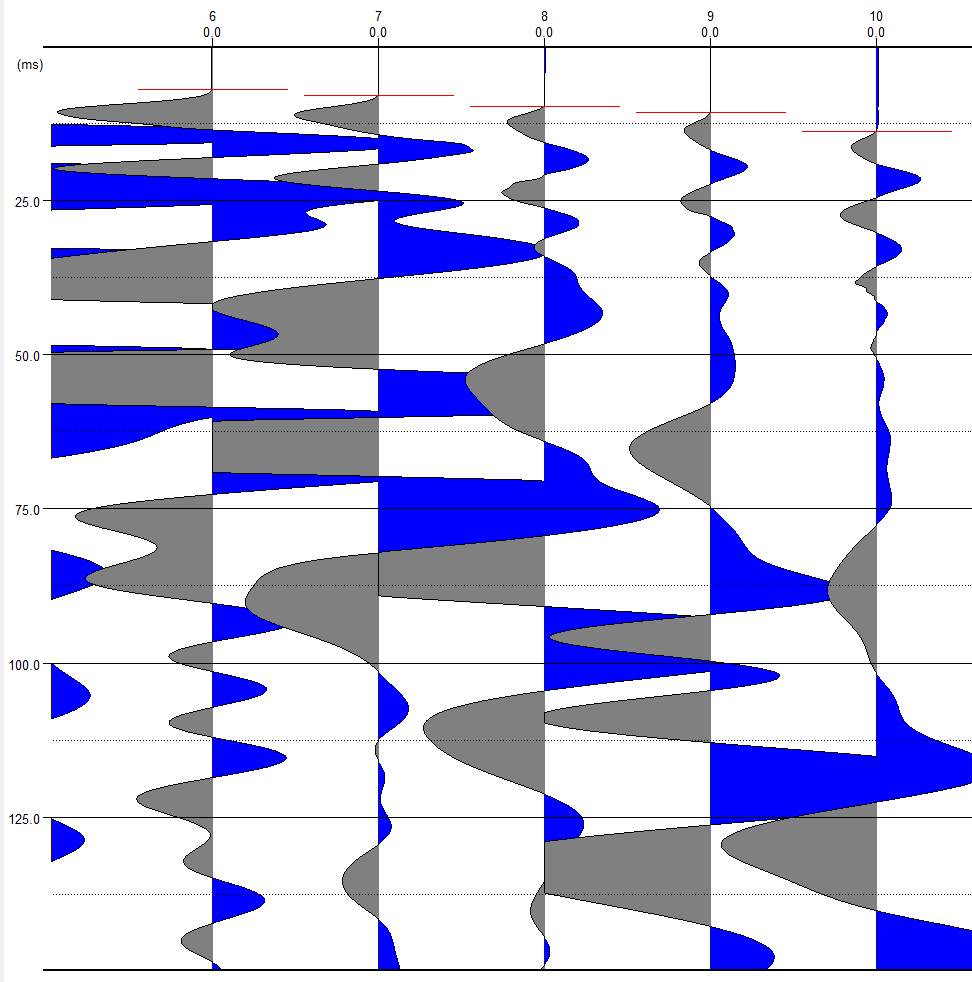
Figure 2. P-wave first break or first arrival times. The first-break times are marked by a red linew at each geophone. Wave arrivals following this are various types of reflected and refracted waves, from even deeper boundaries than the first boundary.
All the complexity of wave arrivals following the first break (Figure 2) are not needed in classic seismic refraction is not needed - all we use are the first-break (or, first-arrival) times, i.e. the time of the red bar (in figure above) at each geophone distance. But other seismic methods do use the later arriving waves. The complexity of the "wave-field" is whatmakes seismology difficult, but, if you are so inclined, also interesting.
Plotting First-arrival Data
If you are using a spreadsheet to plot your first-arrival data in your reports, you will want to make it look something like Figure 3:
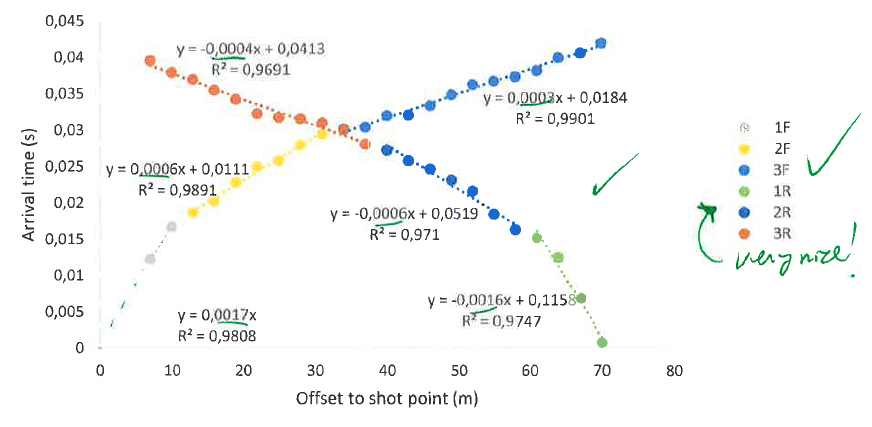
Figure 3. Example plot of "forward" and "reverse" first-break data. Arrival times (dots) are grouped together between slope breaks and the best linear-fit is displayed for each group along with the R-squared measure of fit value.
Back to the GEOL 420 Homepage